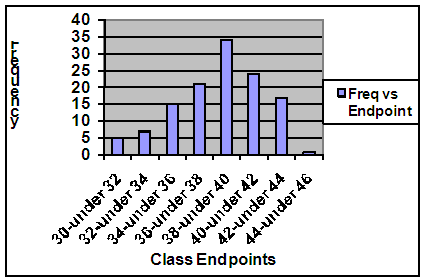
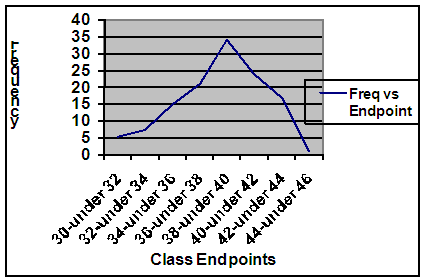
1. Construct
a histogram and a frequency polygon for the following data.
|
Class Interval |
Frequency |
|
30-under 32 |
5 |
|
32-under 34 |
7 |
|
34-under 36 |
15 |
|
36-under 38 |
21 |
|
38-under 40 |
34 |
|
40-under 42 |
24 |
|
42-under 44 |
17 |
|
44-under 46 |
8 |
Answer
 |
|
 |
